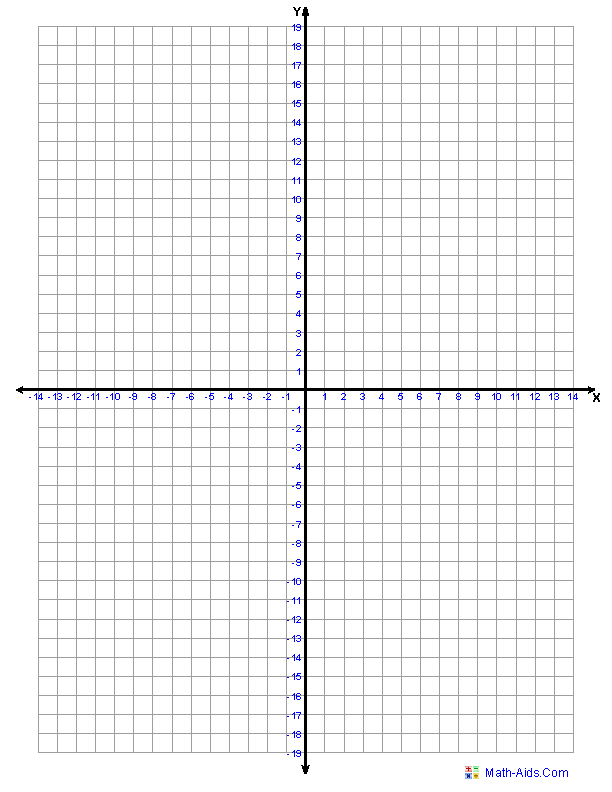
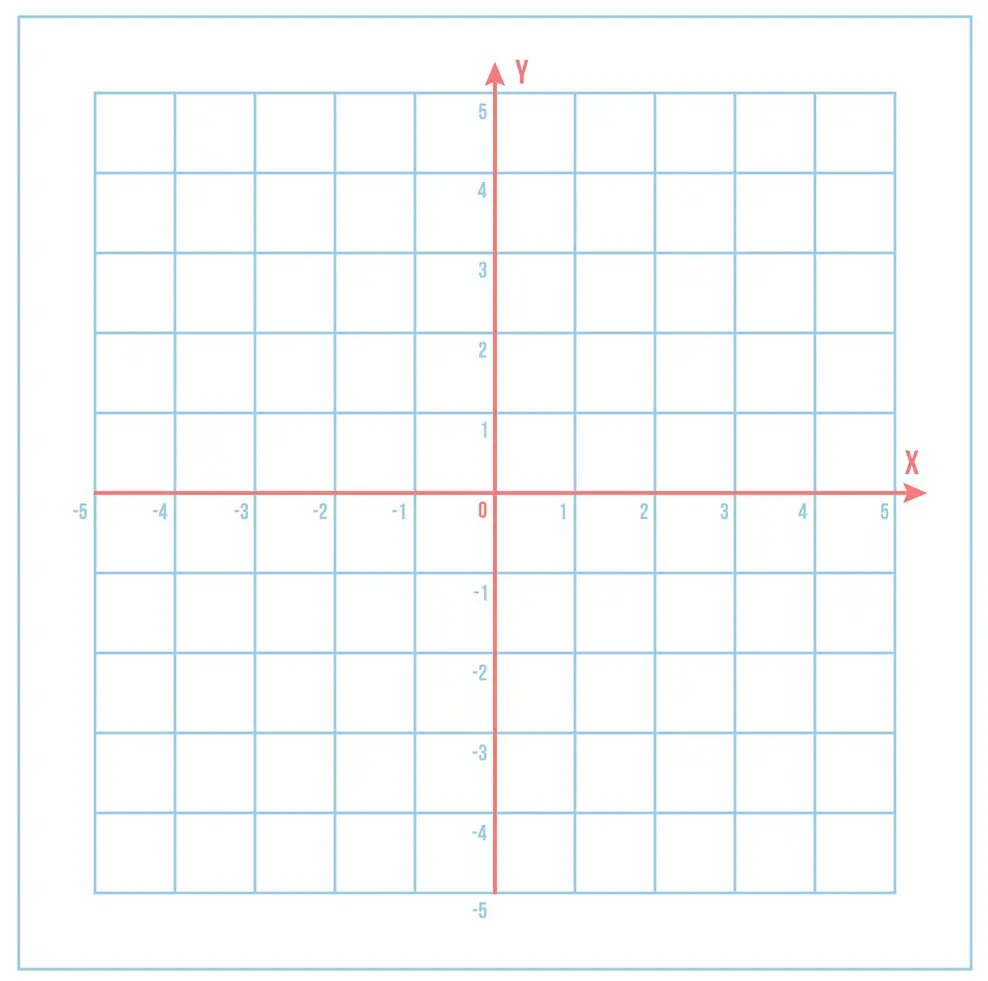
Students learn how to draw coordinates on x and y axis in Mathematics with coordinate graph paper. Using statistical methods, coordinates are plotted with predetermined measurements on this graph paper.
- Staples Graph Paper
- Beading Graph Paper
- Brick Stitch Graph Paper
- Circular Graph Paper
- Interactive Graph Paper
- Graph Paper with Axis
- Hexagon Graph Paper
- Diamond Graph Paper
- Log Graph Paper
- Isometric Graph Paper
- Dot Graph Paper
- Knitting Graph Paper
- Semi Log Graph Paper
- Seed Bead Graph Paper
Coordinate Graph Paper
The other features are that the structure of this graph is identical to normal graph paper and has margin borders that are well defined. This configuration helps the user to plot a coordinate graph, precisely.
Plane Type Coordinate Graph Paper
Whether it is for professional or personal use, it is possible to download the plane type of coordinate graph paper, free of charge from the web. Subsequently, print out can be taken for further use.
Coordinate Graph Paper with Axis
PDF type coordinate graph paper is used for plotting coordinate graph points in a plane. For this purpose, one should have knowledge of the coordinates (x, y). Here, the user should use 2D formation with two coordinates x and y. The instructions to create such graph points are given below. They are:
Features of Coordinate graph paper
It is necessary to have a good knowledge of the technique that is used while graphing the points in any coordinate plane. In principle, this is done only in the form of x, y. The user should know that x axis is always in the horizontal direction. This means that the x axis goes from left to right. The direction of y axis is in the vertical direction, by moving up and down. Besides, the user should also learn about the numbers.
There are two types of numbers that can be plotted on a coordinate graph paper. They are positive and negative numbers. The user should know where to write the positive number and the negative number. In the next step, he/she should have good knowledge about the quadrants. The entire graph is divided into four specific quadrants and each quadrant is designated by + and – symbols.


Leave a Reply